Building a professional Business Plan
Table of contents
1. What is a Business Plan?
At Reportly, when we talk about Business Plan, we are talking about the financial modelling that enables you to test the validity of your business model and its financing requirements. This modelling takes the form of a Excel file structured into several interconnected tabs, enabling you to strategically manage your growth over 3 to 5 years with monthly granularity.
To achieve this, you will obviously need to have the facts to back up your assumptions. All the work involved in analysing your market (potential sales volumes, pricing, churn) or the market in general (labour costs, rents, interest rates) should be carried out beforehand. Some founders choose to formalise this analysis work in a summary Word document presenting their strategic vision, their market analysis and their study of the competition. This approach can be useful for putting the figures into context and sharing your vision with your investors.
The power of the Excel format lies in its ability to project your financial statements dynamically. Your growth assumptions automatically feed your income statement, which in turn impacts your cash flow and balance sheet. When you change a parameter, such as your churn rate or average price per user, your entire model is instantly recalculated. This approach not only allows you to automatically calculate your unit economics and key metrics, but above all to test different growth scenarios to understand their impact on your trajectory.
2. Complete structure
A Business Plan must meet certain 'technical' criteria to be truly operational. Legibility allows the reader to find information easily, granularity ensures a sufficient level of detail without compromising clarity, and consistency ensures that all the tabs are interconnected and that the formulas are calculated correctly from one end of the model to the other.
In terms of content, as the final idea is to model your three financial statements (income statement, balance sheet, cash flow), the BP will have to contain not only the said financial statements but all the elements that led to their drafting.
Income statement
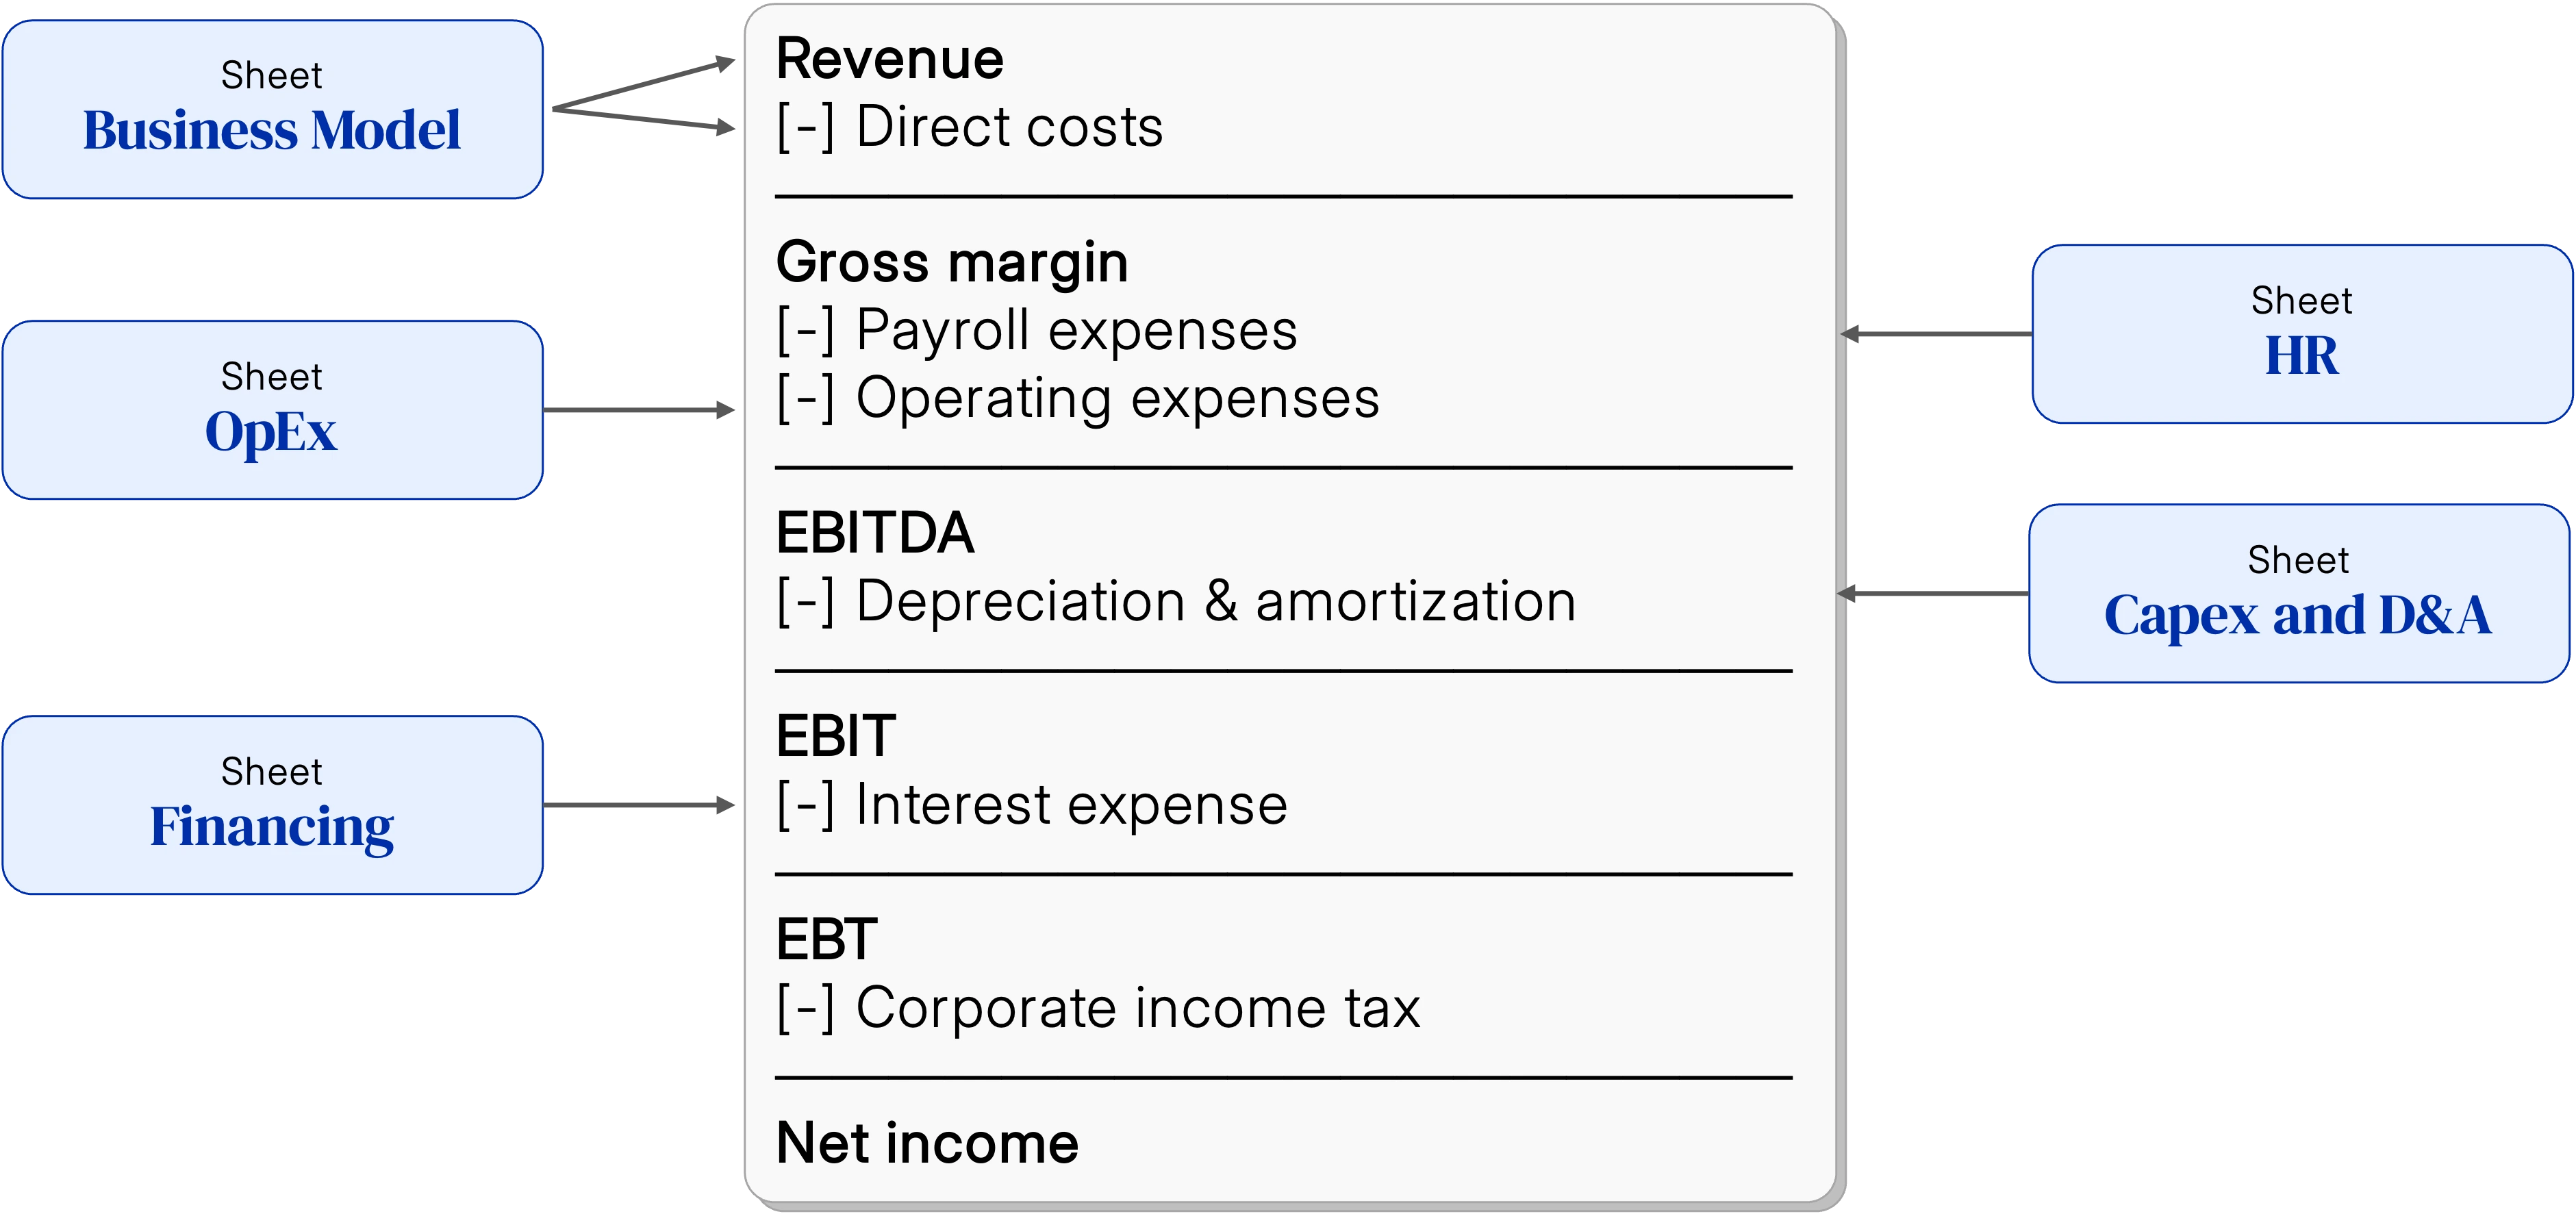
To construct your income statement, you will need to model your sales, variable costs (Business Model tab in our templates), fixed costs (OpEx and HR tabs), depreciation (CapEx & D&A tabs) and interest (Financing tab).
The income statement projects your profitability month by month. It starts with your annualised recurring revenue, from which it subtracts your variable costs to calculate your gross margin, then your fixed costs to arrive at your EBITDA or operating profit. This table is built automatically from your assumptions and includes your recruitment plan.
Cash flow
Flows relating to operations are taken from the tabs mentioned above, together with the payment and invoicing schedules that give rise to the working capital requirement. Flows relating to investment come from theCapEx tab and those relating to financing come from theFinancing tab.
Cash flow is often overlooked in favour of the profit and loss account, even though it is critical to the survival of a growing SaaS. It tracks your cash flow month by month, starting with your cash position at the beginning of the period, adding your receipts and subtracting your disbursements. A SaaS may have a positive EBITDA but still be experiencing cash flow problems, particularly because of payment timing differences. It is therefore essential to maintain a Runway of at least 12 months.
The balance sheet
The balance sheet, for its part, is simply the consolidation of all the tabs mentioned above. It shows your financial position by listing your assets (cash, trade receivables, fixed assets) on the one hand, and your liabilities (trade payables, borrowings) and shareholders' equity (share capital and accumulated profits) on the other. Although it is generally less closely scrutinised by investors than the P&L or Cash Flow, it is still necessary to have a complete picture of your company's financial health.
3. Modelling
The order in which we suggest modelling is simply a reflection of the BP philosophy: "We have revenue ambitions, here are the resources we will need to deliver, first operational, then financial."
3.1 Business Model
This is the heart of the reactor, because the two aggregates modelled here, sales and variable costs, determine the gross margin, which is the first proxy for the viability of your business.
Sales figures
First we will try to determine monthly acquisition volumes and then apply net retention metrics (NRR).
Note: Assuming that the market practice is to objectify the sales teams at New MRR and those of Customer Success at Upsell/Cross-sell, this model will only use fiduciary notions as parameters and the vision number of acquired/lost customers will only be retro-engineered indicators.
The four key assumptions will therefore be :
- New MRR monthly
- Churn MRR monthly
- Upsell MRR monthly
- Downsell MRR monthly
The value shown will correspond to the monthly value at the end of the year, enabling linear changes to be made between each year.
The idea is to create cohorts of MRR to which we apply the evolving NRR. This will give us a monthly MRR, which summed over 12 months gives the turnover.
By applying the following formula, we will be able to retro-calculate the number of users:
Direct costs
Here we include the costs of hosting and Customer Support (not Success), without which the product could not run.
For hosting costs, an average cost per user will be used.
Whereas for Customer Support, we're going to use a number of customers (or users) covered by CS per month. This will determine the number of employees and the associated cost will be entered in the HR tab.
3.2 Human Resources
Because your teams are your strength.
Team
Here we will model the teams, which we will classify according to Business Units: Tech & Product,Sales & Marketing,Customer Success,SG&A.
Of these business units, only Sales (SDR, AE) and CSM will be managed programmatically, on the basis of new MRR and Upsell MRR targets respectively.
As for the others, they will be managed according to the number of posts open at the end of the year, with a linear progression.
Gross salaries
Here the only two assumptions are the average gross annual salaries for each position and the average annual increase in these salaries.
Bonus
Although bonuses are usually given for Sales and CSM, we have deliberately left open the possibility of adding bonuses for other positions.
What's more, it is assumed that this bonus is paid on a quarterly basis to simplify the model.
Loaded salaries
Here the calculations are made automatically based on a URSSAF scale and the gross amounts paid to your employees.
3.3 OpEx (excl. HR)
For the majority of operating expenses, it is generally preferable to budget by the year, quarter or month. It all depends on your budgeting habits and the line item in question. In any case, as the model is designed to provide visibility on a monthly basis, these budgets will be automatically converted into monthly values and then consolidated on an annual basis.
Certain items, such as rent and software costs, will be budgeted per employee, ensuring that structural costs remain consistent as the business grows.
Marketing costs will be driven by the cost of customer acquisition (CAC). If your acquisition strategy is purely outbound (sales team), then the value of this CAC can remain at €0.
The distinction between fixed and semi-direct costs (which vary according to the size of the teams, which in turn vary according to the number of customers) will be introduced.
3.4 CapEx (and D&A)
Although the activities of SaaS do not inherently require major investment, certain expenses such as IT equipment (if not leased) must be amortised.
The outputs of this tab will therefore be the fixed assets, the associated D&A (for PnL) and consequently the net fixed assets (for the balance sheet).
Note: Capitalised production is deliberately not included in this model, as it is a non-cash accounting artefact specific to certain countries, including France.
3.5 Profit & Loss (PnL)
This tab demonstrates the economic viability of your model. This is an output tab, which groups together the outputs from the following tabs:
3.6 Cash Flows Statement
This tab reflects the economic reality of your company more than the income statement. In the case of SaaS, the central cash flow is the operating cash flow, which is derived from the income statement.
As a result, your revenues and costs will now include invoicing and payment times, giving rise to Working Capital Requirements. Variations in this requirement generate an inversely proportional component of operating cash flow. For example, if your BFR increases from €60K to €90K between two periods, then your operating cash flow will decrease by €30K between these two periods.
The cash flow relating to investments is no more and no less than the values in the CapEx and D&A tabs.
Finally, the cash flow from financing. This flow depends on the two flows mentioned above, because as its name suggests, it will be used to finance your operations and the investments you need to run your business. See the Financing section for more information.
3.7 Financing
Although the treatment of this tab comes 'late' in the treatment flow, it is nonetheless key. Key because the very philosophy of a Business Plan (or indeed of a business at all) is to determine the financial requirements of your ambition.
On the basis of operating and investment cash flows, you can determine your company's financing requirements.
If the sum of your cash flows is negative, you will need to raise 1.1x* of that amount. If it is positive, each additional euro of funding will be used to boost your growth. A feedback loop is then introduced: if the business is profitable, you will seek to acquire more customers, involving more costs, temporarily reducing your level of profitability and therefore your operating cash flow, and consequently your financing requirements will increase.
There are a multitude of financing methods, so for the sake of simplicity, our model focuses on the following 4:
Capital increase
Although the funds raised will not place any additional financial burden on your business, if your company is successful (which we hope it will be!), it will reduce your assets as a founding shareholder. So this is another "cost" perspective.
Bank debt (or Bonds)
The concept is simple: you borrow funds from a bank (bank debt) or investors (bonds) in exchange for which you must repay the capital (over a predefined period and frequency**) and the associated interest (based on a predefined interest rate).
Convertible bonds
These are bonds that give stakeholders the option of converting the debt into capital***(if the business delivers on the promise made at the time of fundraising) or retaining the form of the debt as debt****(repayment of capital and payment of interest).
Grants
It is common for state, regional and even local institutions to support businesses that promise to boost the economy on the above-mentioned scales. While some are dedicated to financing innovation, others are repayable advances (often at 0% interest), offering an alternative means of financing working capital requirements (BFR) or temporarily negative operating flows.
Notes :
(*)A safety margin of 10% is included. This margin can of course be revised downwards (but this could prove problematic as you will have less room to manoeuvre if your plan does not go according to plan), or upwards (but over-financing can prove costly, whether in terms of capital transferred or the burden of debt on your business).
(**)It is common for capital repayments and interest payments to be made monthly, quarterly or even half-yearly, respectively and independently of each other. The model also includes the possibility of bullet repayment (100% of the capital repaid in one go on a predefined date), although this is less likely for a start-up company.
(***)It is possible that the terms of the bond contract provide for conversion into capital not only of the principal borrowed but also of the interest generated between the contracting of the debt and its conversion. It is also possible that this interest will be capitalised, i.e. the interest for the second year will no longer be calculated on the basis of the principal, but on the basis of the principal plus the interest generated in the first year (and so on). It should be noted that these convertible bonds are always subject to an end date, representing in a way the trial period offered by the investors to the founders so that the latter can deliver on their operational promises.
(****)Since the aim of a convertible bond is to be converted, failure to convert it would represent a failure of investment, and many funds therefore include a non-conversion premium (NCP) to ensure a return on this financing vehicle. For example, you borrow €100,000 from a fund, with a 10% interest rate and a 15% NCP. If these bonds are not converted on the maturity date (1 year later in this example), your company will have to repay €100 × (1+10%) × (1 + 15%) K, i.e. €126.5 K.
3.8 Balance Sheet
The balance sheet is a representation of the company's assets at a given point in time and the resources deployed to create them.
So this tab, although less important than the PnL and Cash Flow Statements for SaaS/digital companies, will almost always be requested by banks when raising bank debt.
The Balance Sheet centralises all the balance values, not flow values, from the other tabs mentioned in this guide.